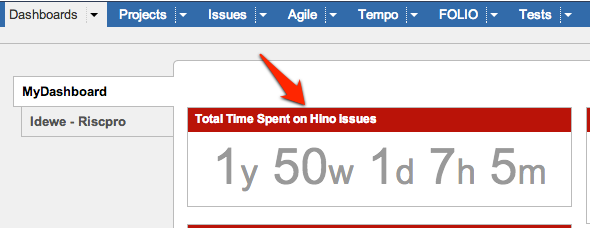
The Aggregation Gadget maps a function to an entire column of a selected set of issues. This allows the user to know the total time spent on a project, or the total remaining time of a project, the average number of story points, the total number of story points, ...
.png?version=1&modificationDate=1522060527396&cacheVersion=1&api=v2)
...

The aggregated value is the result of:
- a filter that determines which issues will be aggregate;
- a column yielding the values to aggregate;
- and finally a function that specifies what the aggregation must do. Right now SUM and AVERAGE are supported functions.
...
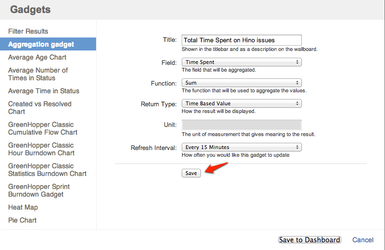
Configuration
Like all gadgets, the Aggregation Gadget can be added from the dashboard. Once added, it must be configured.
.png?version=1&modificationDate=1522060554280&cacheVersion=1&api=v2&height=250)

- The title is shown on the dashboard and wallboard to identify the gadget. To make it clear, provide in here what exactly the aggregation does, e.g. "Average number of story points from RISCPRO project" or "Total amount of time spent on recruitment".
- The saved filter can be any of the filters you have access to, either one of your own (private) filters or one of the filters shared by another user. This filter sets the issues that will be used, and thus the scope of the aggregation.
- The field is any of the aggregatable system- and custom fields. These are fields that are either numerical or of datetime format. This field determines the column, and thus the values that will be aggregated.
- The function can be either sum or average, and determines what will be done with the collected values. In the future this could be expanded with other functions, such as max, min, ... if provided useful.
- As internally both time and number values are represented as numerical values, and aggregated as such, a return type must be specified by the user. This causes the returned value to be formatted as "123456" for a Numerical Value or as "1w 2d 3h" for a Time Based Value.
- The unit of measurement is displayed next to the NUMERICAL result, to give meaning to the number. This can be any input that makes it clear to the user what the number represent, e.g. "story points" or "sp".
- The refresh interval determines if and how often the gadget recalculates itself. This can be every 15 minutes, 30 minutes, every hour, every two hours or never.
Wallboard
.png?version=1&modificationDate=1522060566832&cacheVersion=1&api=v2)

The gadget has a different look, uniform to the Project Metric gadgets, when viewed on a wallboard.
Navigation to Issue Navigator
When the user clicks on the aggregated value, he or she will be redirected to the Issue Navigator which will display the filter (and its matching issues) used by the Aggregation Gadget.
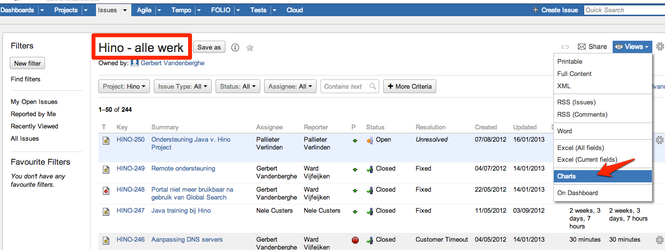
Adding the gadget from the Issue Navigator
The gadget can be added to the dashboard from the Issue Navigator. Note that in order for this to work, the filter must be saved. The following steps must be followed to add the gadget to the dashboard:
Navigate to the Issue Navigator and go to the Charts view.

...
Fill in the configuration and save the configuration.

...
Save the gadget to the dashboard.
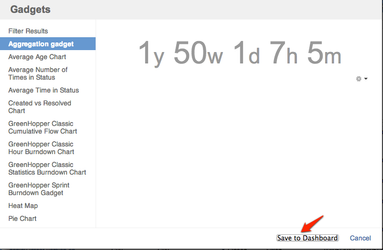

The gadget can then be used from the dashboard.